 Grains –
This morning we’re looking at some of the acreage numbers ahead of the report on Friday. For reference, here is a quick breakdown of the average guesses:

Today we’re simply looking at whether there is any tendency of the average guesses vs. the actual USDA numbers. For our purposes this morning, we’re only going to look at corn and soybeans. We’ll discuss wheat at some point later this week.
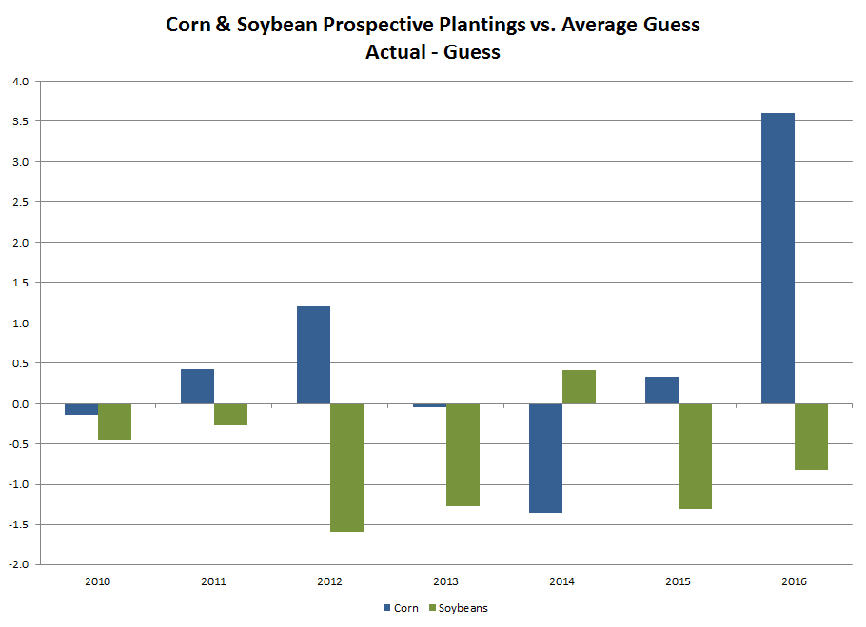
The chart below breaks down the individual corn and soybean actual figures vs. the average guess. The first thing that immediately sticks out in the chart is there seems to be a general tendency for soybean area to come in less than the average guess over the past few years. Only in 2014 did the actual figure turn out to be larger than the average guess, and even in that case the miss was fairly small.

The second item that stands out is there doesn’t appear to be any particular bias present in corn. Clearly in corn the major miss on last year’s report is what stands out. With that in mind I also combined the two together for the second chart below. This shows the combined acreage vs. the combined average guess. Again generally you can see there is a tendency for the combined acreage total to come in slightly less than the average guess, but as mentioned above that is largely due to soybeans. Last year’s big miss to the upside in acreage stands out as quite an outlier.

So what happened last year? Well, I think I’ve mentioned before that the USDA (until this year) has been banking on declining acreage in their Outlook Forum projections due to lower projected farm incomes as crop prices have come off their highs. This has thus far proven incorrect, but in the case of last year I think it proved costly to the market as I think the relatively low starting point of the 2016 Outlook Forum fooled most. We’ll discuss March USDA figures vs. Outlook Forum figures in more detail tomorrow.
Please note this is just a small sampling of commentary available to clients. Please visit www.nesvick.com for more information.
DISCLAIMER:
The information contained herein has been taken from trade and statistical services and other sources we believe are reliable. Opinions expressed reflect judgments at this date and are subject to change without notice. These materials represent the opinions and viewpoints of the author and do not necessarily reflect the opinions or trading strategies of Nesvick Trading Group LLC and its subsidiaries. Nesvick Trading Group, LLC does not guarantee that such information is accurate or complete and it should not be relied upon as such. Officers, employees, and affiliates of Nesvick Trading Group, LLC may or may not, from time to time, have long or short positions in, and buy or sell, the securities and derivatives (for their own account or others), if any, referred to in this commentary. There is risk of loss in trading futures and options and it is not suitable for all investors. PAST RESULTS ARE NOT NECESSARILY INDICATIVE OF FUTURE RETURNS. Nesvick Trading Group LLC is not responsible for any redistribution of this material by third parties or any trading decision taken by persons not intended to view this material